I used k-means clustering to group similar NBA shot charts and identify common shooting tendencies.
Methodology
My approach was to bin groups of shots, much like we sometimes do for visualization. This let me represent the data as a vector showing the frequency of shots from individual locations.
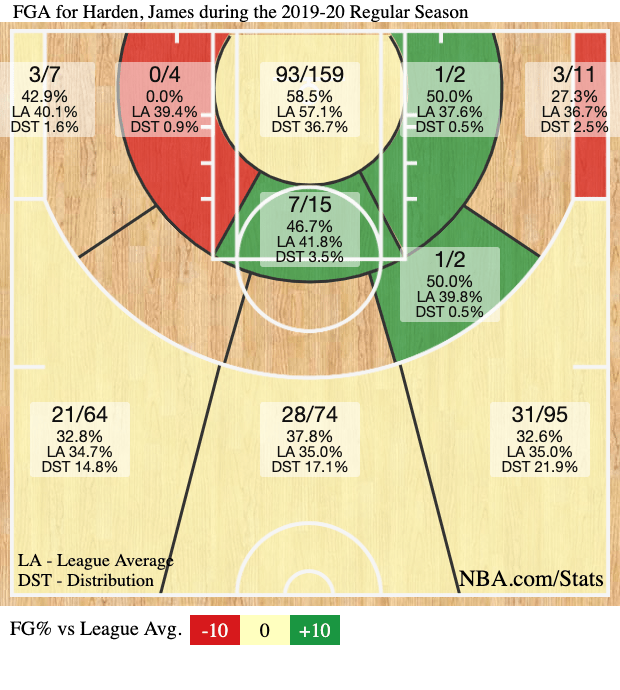
I separated shots into 14 locations provided by the stats.nba.com API and created a 14-dimensional vector for each player in each season. Each value represents the player’s shot frequency from one location on the court. I did not include field goal percentage because I wanted to highlight shooting tendencies rather than shooting ability.
I could not use the raw X-Y coordinates because players take different numbers of shots, which would give each player a vector of a different size and prevent me from applying k-means clustering.
Number of Clusters
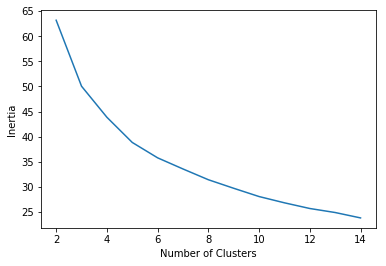
I initially used three clusters, but the distinctions between two of them were subtle. I then used the elbow method to estimate a better number of clusters. The plot suggested that the optimal number was probably around five.
Clustering Results
After running the model with five clusters, I used example shot charts to interpret each group.
Cluster 0: Emerging Stretch Forwards
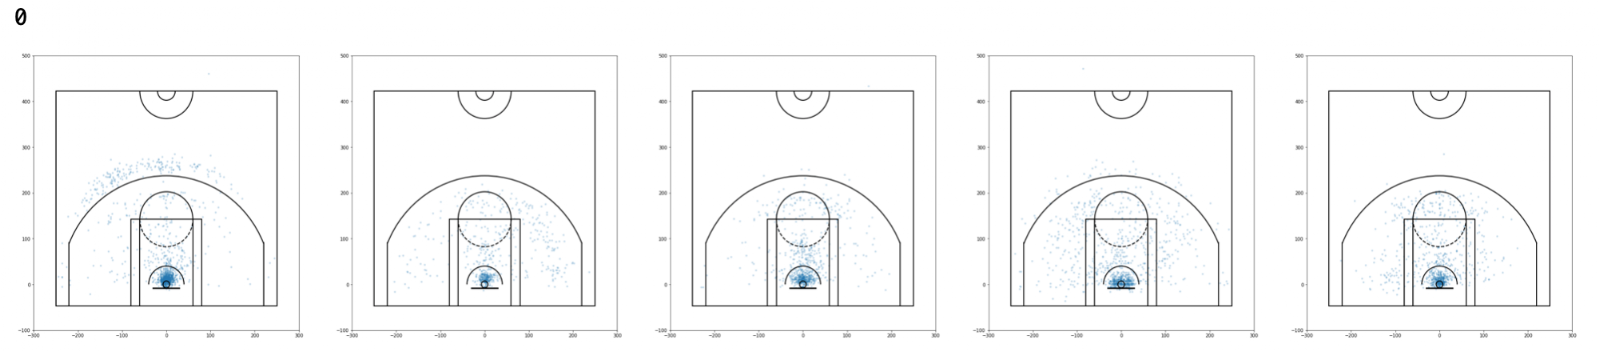
Cluster 0 represents players who mainly shoot in the paint but also take some shots outside it. They do not shoot many threes. My assumption is that these players used to be traditional big men but are transitioning into stretch forwards.
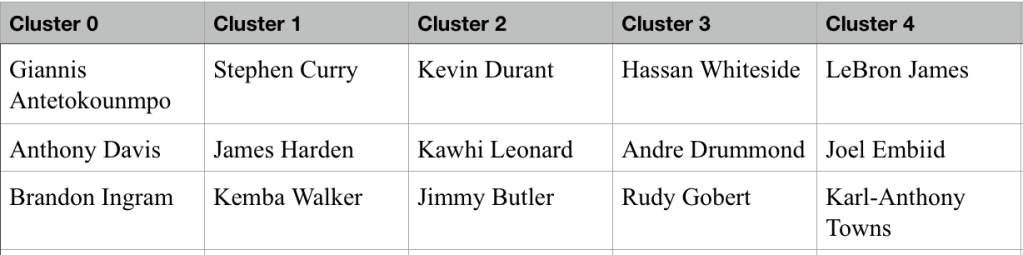
Cluster 1: Baseline Moreyball
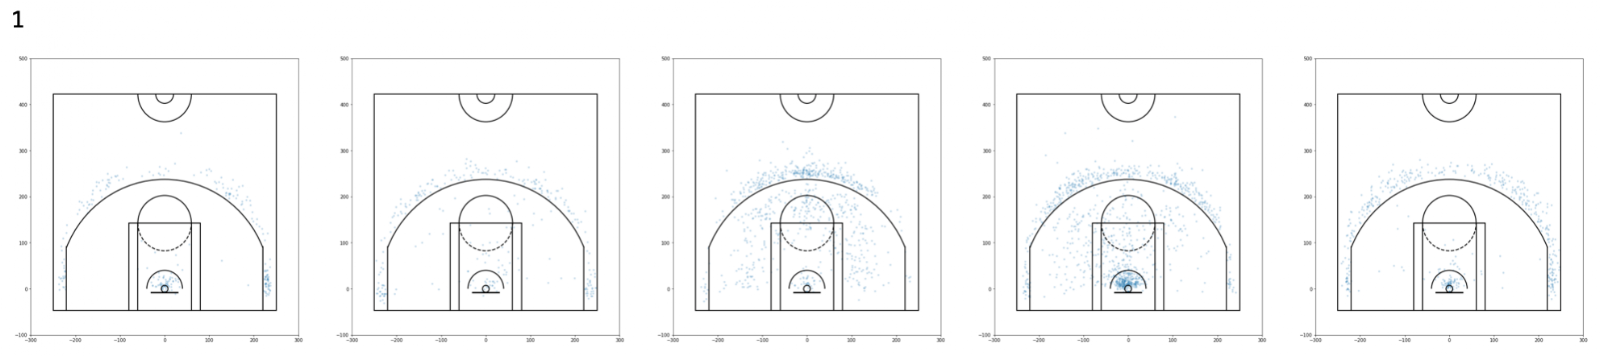
Cluster 1 represents players who shoot threes and shots in the paint, matching Moreyball ideals. However, they take more threes than shots in the paint.
Cluster 2: Mid-Range Shooters
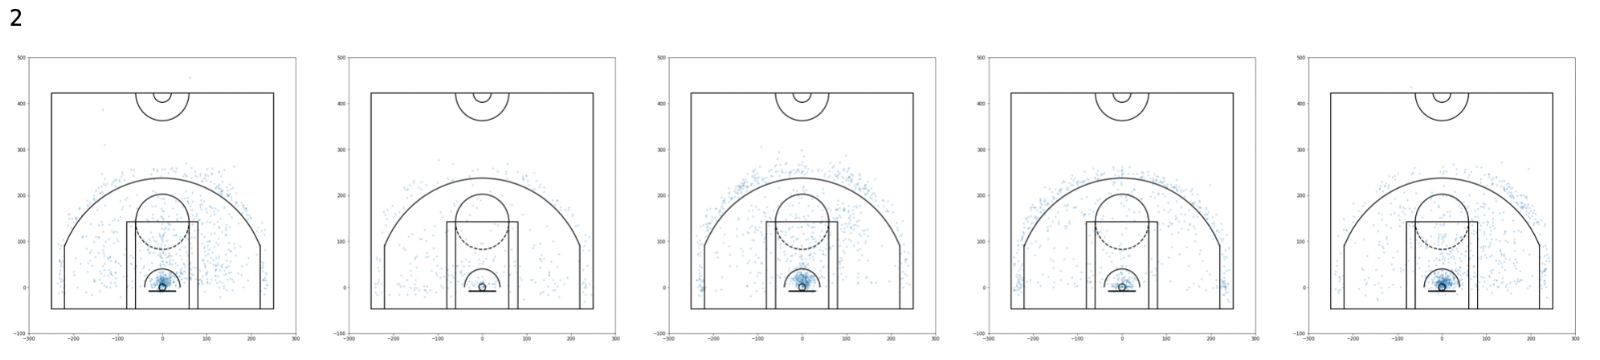
Cluster 2 represents players who prefer to shoot mid-range shots.
Cluster 3: Traditional Big Men
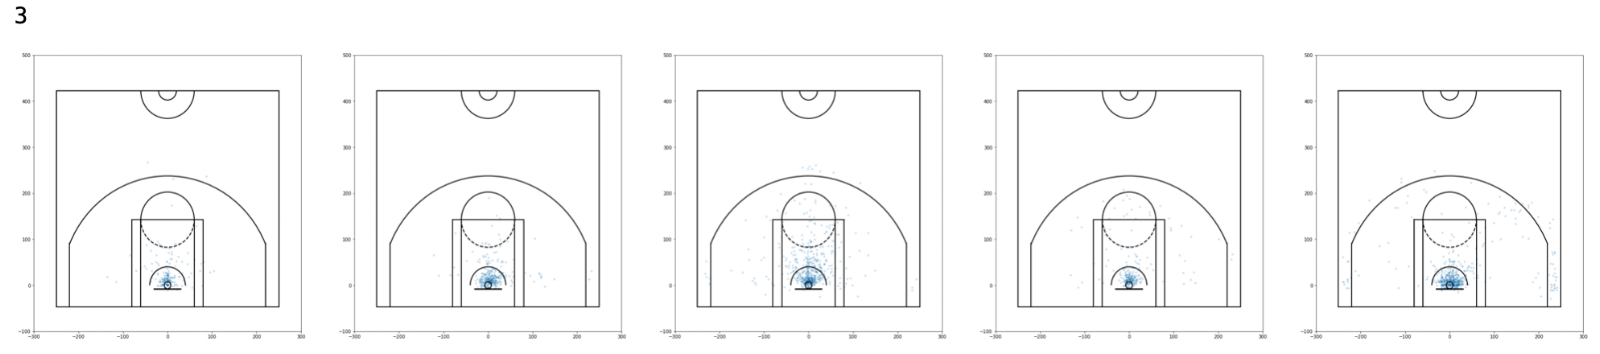
Cluster 3 represents players who play in the paint and leave it extremely rarely.
Cluster 4: Interior Moreyball
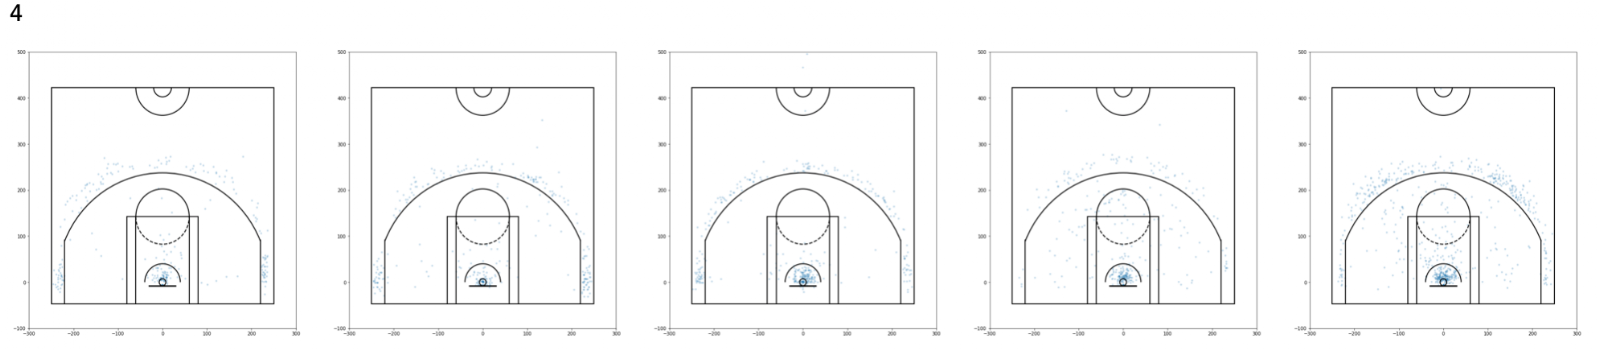
Cluster 4 also represents players who shoot threes and shots in the paint. Unlike cluster 1, these players take more shots in the paint than threes.
LeBron James and Joel Embiid are in the same cluster. They are not the same type of player, but their shooting tendencies are quite similar. This is why adding something like assist data could improve the model.
Team Comparisons
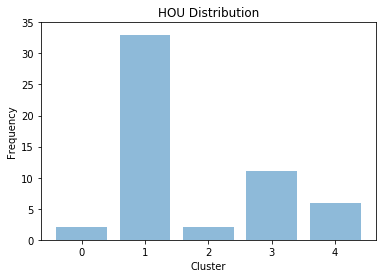
I looked at the Rockets’ distribution of clusters for the 2018-19 season.
For comparison, this is what the Knicks looked like.
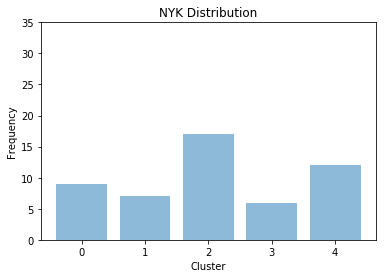
The Rockets relied heavily on Moreyball, particularly its three-point-focused version. The Knicks had a much less three-point-oriented distribution.
Opportunity and Efficiency
I cross-referenced the clusters with player statistics to see which groups relied on the ball more.
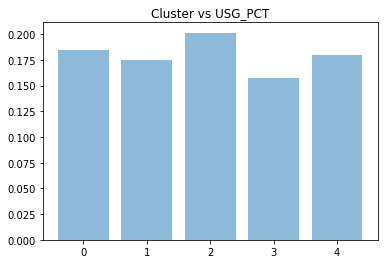
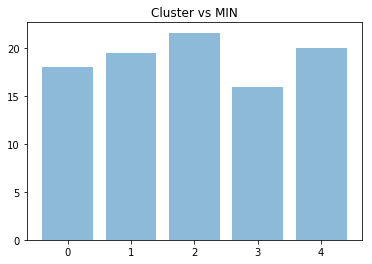
The mid-range cluster tends to have more opportunity than the other clusters. I believe this is related to the connection between mid-range shooting and isolation basketball. Players like Kevin Durant, Jimmy Butler, and Carmelo Anthony all fall into this cluster and are known for playing isolation basketball.
I also compared the clusters by field goal percentage, three-point percentage, and effective field goal percentage.
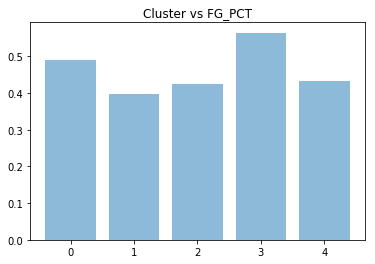
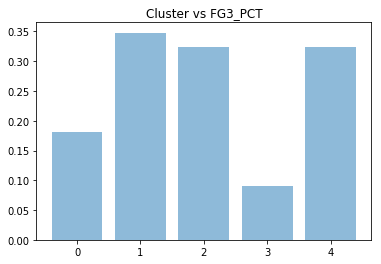
Cluster 1 takes a lot of threes: it has a higher three-point percentage than all the other clusters but a lower field goal percentage. We can also confirm that cluster 3 represents traditional big men and is full of extremely poor three-point shooters.
Clusters 2 and 4 have similar three-point and field goal percentages. However, cluster 2 takes fewer threes and more mid-range jumpers, which are generally less efficient. This is reflected in effective field goal percentage.
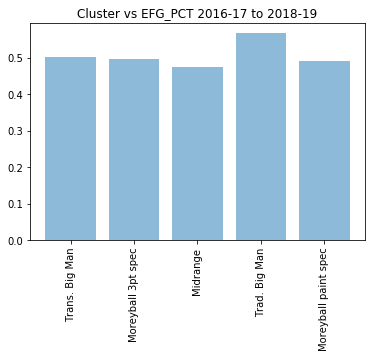
Cluster 0 is also relatively poor at shooting but ventures outside the paint more often than cluster 3. Giannis Antetokounmpo and Anthony Davis are good examples: both were expanding their games to the three-point line but were not yet efficient from that range.
These graphs also show that mid-range players are the least efficient shooters by effective field goal percentage, while traditional big men—or players who rarely leave the paint—are the most efficient by this measure.
Cluster Distribution Over Time
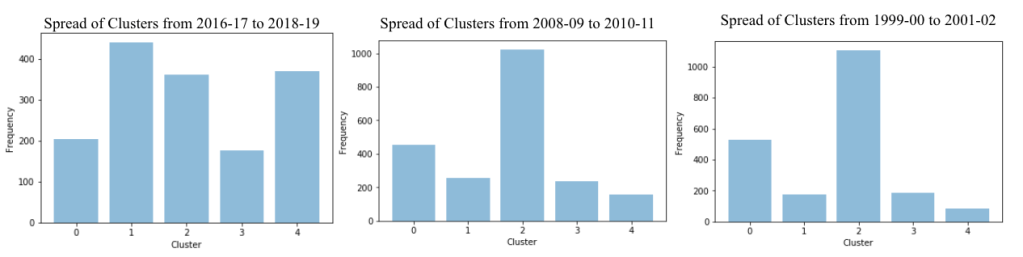
I used the same clusters across seasons to see how their distribution changed over time. Cluster 2 was the most popular for many years. However, with the rise of Moreyball and efficiency-focused basketball, clusters 1 and 4 became more popular in recent seasons.
The distribution did not change much from 1999-00 to 2008-09. The number of mid-range players decreased slightly over that period, but the shift was small. The major change in cluster distribution happened more recently.
Future Work
I want to see whether these clusters correlate with win percentage. This could show which shooting profiles translate most directly to winning. I also want to add other mapped data, such as where assists were made and where rebounds were collected, to see whether it improves the player groupings.
You can view all players in each cluster in the linked spreadsheet. The source code is available on GitHub.
Thanks to Savvas Tjortjoglou for his code for outlining the NBA court in Matplotlib.