With the NBA season being postponed, there has been a lack of basketball in the world. As a result, I thought it would be interesting to look more deeply at whether the Elam Ending has a place in the current NBA and how it would work.
What is the Elam Ending?
If you didn’t watch the All-Star Game in 2020, the Elam Ending gives each team a target score at the start of a period rather than having them fight against the clock. Rather than having a five-minute overtime or a 12-minute fourth quarter, each team would have to score a certain number of points, based on the higher score in the game.
For instance, if Team X had 75 points and Team Y had 70 points at the end of the third quarter, the target score would be some number of points above team X’s score. In the All-Star Game, this number of points was 24, in memoriam of Kobe Bryant. If 24 was used in this hypothetical game, the target score would be 99, and the first team to reach 99 would win the game.
The Sun Sentinel published a more in-depth description of the Elam Ending.
Overtime
Applying the Elam Ending to overtime in the NBA has been widely suggested by NBA fans. In fact, Daryl Morey, the Houston Rockets’s GM, supports the implementation of the Elam Ending as well. It seems like a perfect, non-intrusive way of applying the idea to the NBA. As a result, we will investigate how the Elam Ending in overtime would work in today’s NBA.
How many points till the target score?
Teams have scored, on average, 10.3 points per overtime period in the league from 2011-12 to 2019-20.
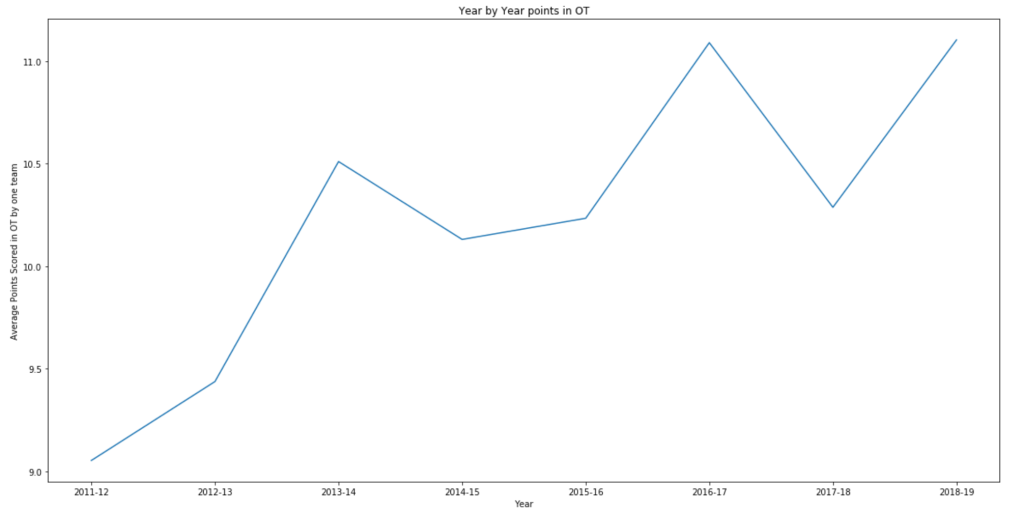
The above graph describes teams’ year-by-year points in overtime. It is evident that the number of points being scored in overtime is increasing each year, due to the rise of three-point shooting and efficient basketball. As a result, if we would like to maintain roughly the same amount of game time, we should have the target score be 11 points from the score in regulation.
How would win probabilities change?
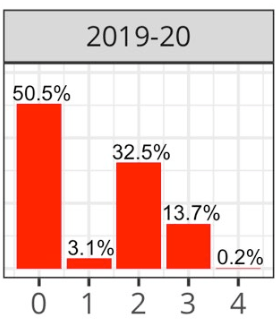
Data provided by Mike Beuoy
For the purposes of this article, I will use the following probability values to examine how the Elam Ending would change things. Thanks to Mike Beuoy for providing these values. For comparisons with the timed overtime period, I use the Inpredictable win-probability calculator.
This graph gives the frequencies of points scored on a given possession. During the 2019-20 season, teams scored zero points on a possession 50.5% of the time, 1 point on a possession 3.1% of the time, etc.
I wanted to examine this in depth, so I started from the beginning of a play with the jump ball. I tried to answer the question: how much does the jump ball affect the outcome of the game?
Using the probability distribution described above, I ran 1 million simulations of an overtime period, going up to 11 points.
The team that won the jump won the game ~54.4% of the time, while the team that lost the jump won the game ~45.6% of the time. This implies a ~4.4% advantage when your team wins the jump ball.
Comparatively, the probability of winning the game given a 5-minute overtime period is ~0.542, negligibly lower than the Elam Ending probability. As a result, it does not seem that the importance of the jump ball changes with the implementation of the Elam Ending.
The next step is to see how the probability of winning a game in the Elam Ending compares to the probability of winning a game in regular overtime.
The first thing to realize is that the win probability in normal overtime is a function of the score differential and the amount of time left in the game. In comparison, the win probability in the Elam Ending is a function of each team’s score and the number of points to the target score.
A major difference is that as time approaches zero in a normal overtime period, the probability of winning a game approaches 1 or 0 with few exceptions. In contrast, with the Elam Ending, the probability of winning the game does not approach 1 or 0, as the team score is not a continuous variable like time is.
This nature is, in part, what makes the Elam Ending so exciting. It makes the losing team always feel like they have a chance, which leads to good play throughout the overtime period.
For instance, if there are twenty seconds left and it is a four-point game in a regular overtime period, the game turns into a free-throw shooting game, which very likely leads to the leading team winning the game. This is also not an exciting game to watch.
Rather, if the score is 6-10 in an overtime period with the Elam Ending, there is a higher probability that the losing team wins the game. This makes the game far more fun to watch and it prevents intentional fouls.
Below are two graphs highlighting the win probability of a team leading by 4. The x-axis on the normal OT graph is the amount of time left in the game, while the x-axis on the Elam Ending OT graph is the game score.
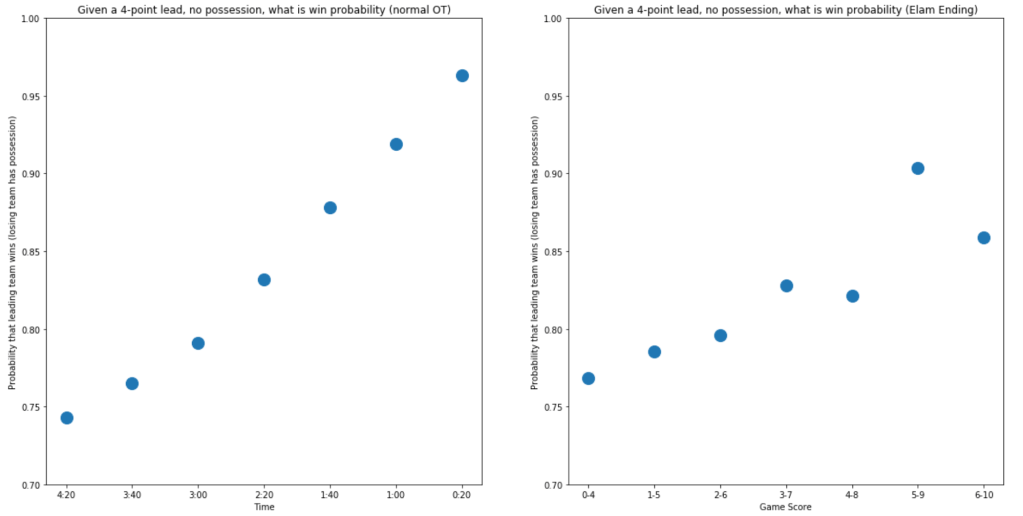
It is evident on this graph that the win probability for the winning team with the Elam Ending is not continuously increasing.
Unlike timed overtime, the relationship between the game state and win probability is not always smooth under the Elam Ending. Both teams can continue moving toward the target without a clock forcing the trailing team to foul.
In addition, the win probability does not approach 1 in the same way it does as time expires in timed overtime. This leaves more uncertainty about the outcome late in the game.
What types of shots should you take?
I also wanted to look at what types of shots the winning teams were taking when they won the game. Obviously, the winning team will score more points than the losing team, but which areas of the game was it exploiting?
Below is a comparative bar chart showing how many one-, two-, and three-point possessions each team had.
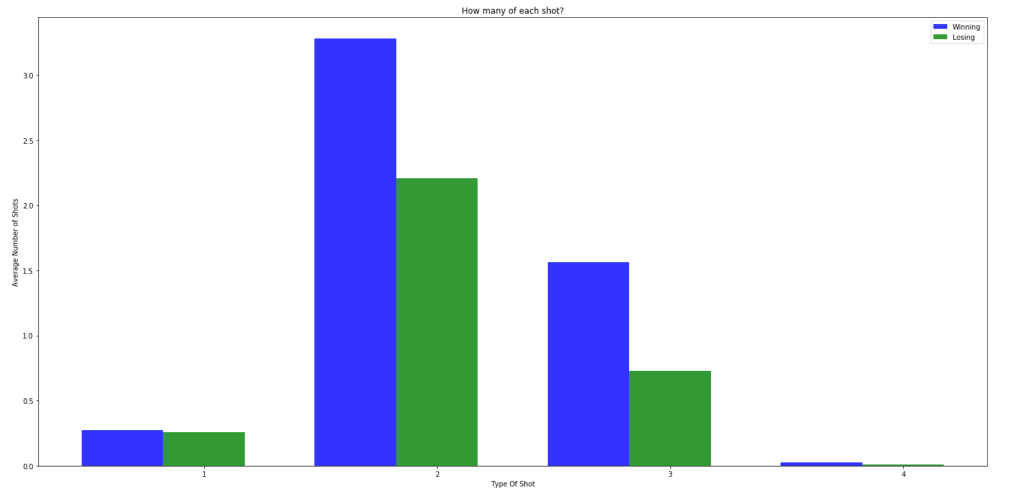
Not surprisingly, the winning team scored more threes and twos than the other team. Based on the difference in the heights of the winning and losing bars in each of those categories, teams, on average, outscore their opponents ~3 points more on 2’s and ~3 points more on 3’s. As a result, based on the average shooting tendencies of an NBA team, 3’s and 2’s are equally important in the Elam Ending.
However, it has been proven time and time again that shooting 3’s usually generates more points per shot. As a result, it is obvious that making a high amount of 3’s could prove useful in any game. However, there is also a point where taking more threes is detrimental in the Elam Ending.
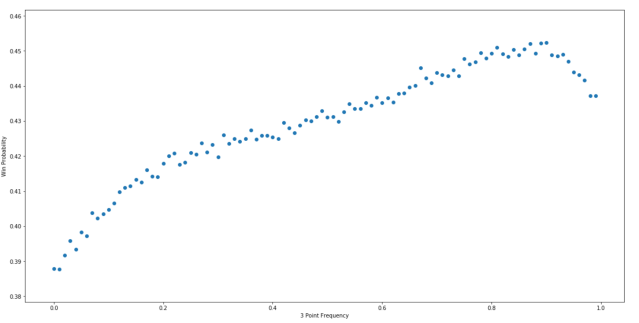
In the graph above, I assume that the three-point shooting percentage is 35% and the two-point shooting percentage is 50%. Because the simulation holds those percentages constant as shot selection changes, it is too simplified to support a recommendation about how often a team should shoot from three.
Conclusion
Although the Elam Ending is nontraditional when it comes to professional basketball, the implementation of the rule in the NBA would make games more exciting. It would introduce more randomness to the game, and have fans holding their breaths until the final shot.