I recently developed a win probability model for the awesome py_ball package.
In this blog post, I’ll describe the methods I used to develop the model.
Methods
The model estimates win probability using the amount of time remaining, the point differential, and which team has possession. Home-court advantage is the only pregame bias, because every input is represented from the home team’s perspective. We hope to add betting odds to produce more accurate pregame probabilities.
Following a method Brian Burke used in his win probability models, we split each game into 960 three-second intervals and train a separate logistic regression for each interval. Each model uses the point differential and possession; time does not need to be an explicit input because each model covers a specific point in the game.
For games that go into overtime, we treat the 5 minutes left as if there are 5 minutes left in the fourth quarter. This is to ensure that there are enough training samples for the model to actually learn something. For instance, there are very few games that go into 4OT, so a logistic regression model would not actually be able to recognize any trends with a lack of data.
The model is trained on five seasons’ worth of data from 2013-14 to 2017-18 games.
Results
We evaluated our model on the 2018-19 data, using a Brier score.

We received a Brier score of 0.167 for our model.
Comparison
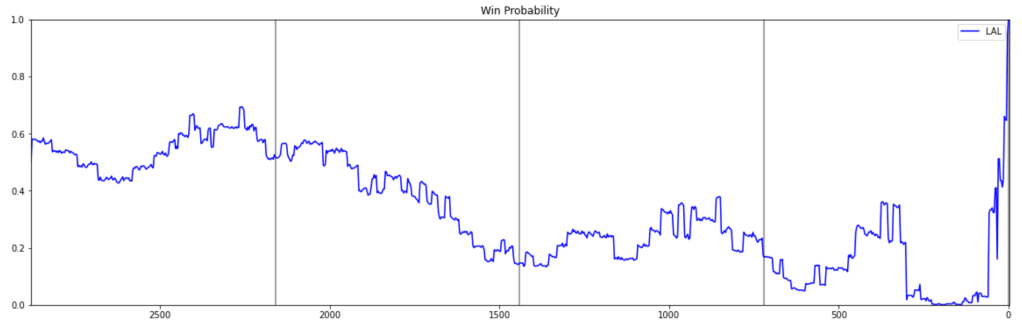
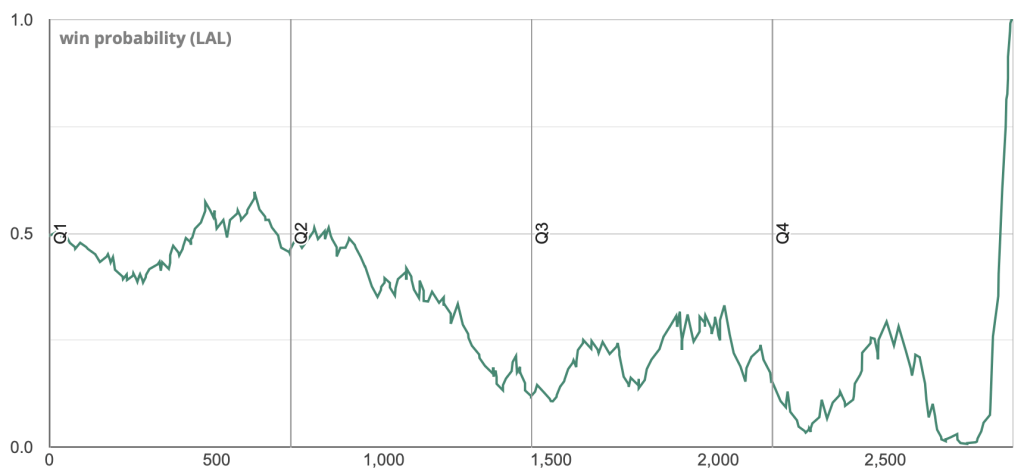
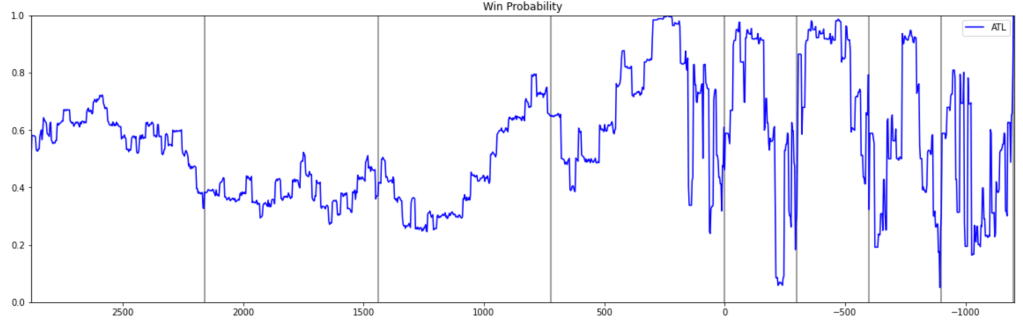
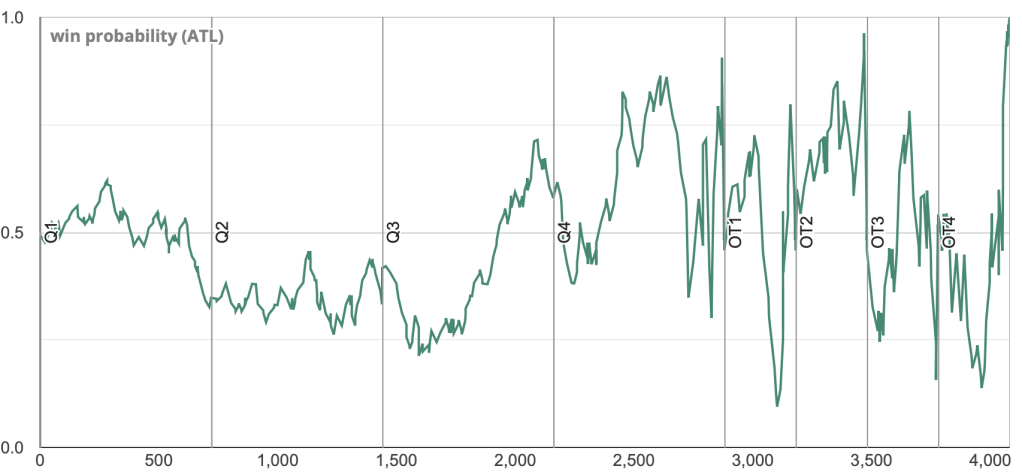
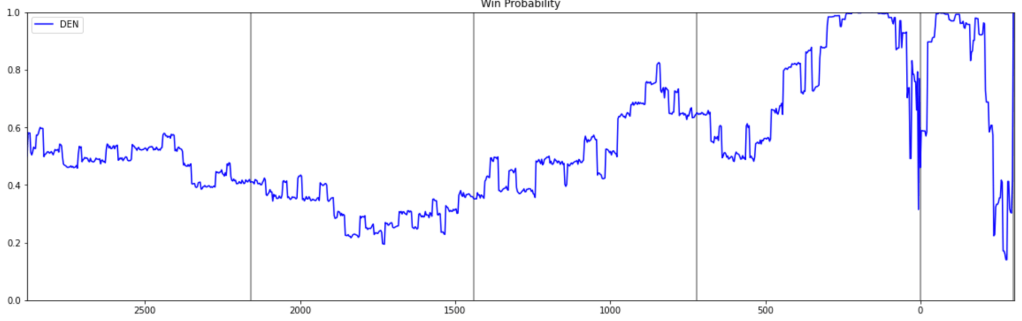
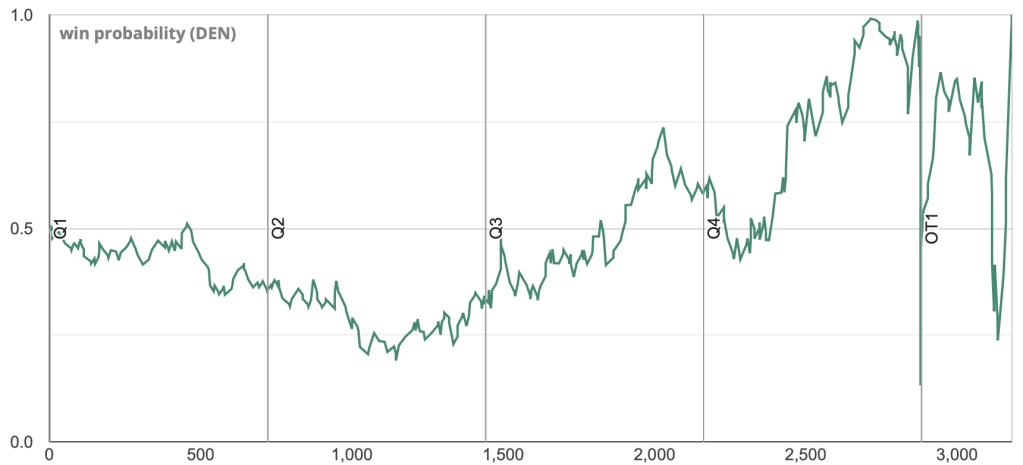
The following examples compare our model (top) with the model from Inpredictable.
Kobe Bryant’s Last Game (LAL vs. UTA, 2015-16)
ATL vs. NYK (2016-17)
DEN vs. DAL (2019-20)
Usage
The model is available in py_ball, along with an example notebook showing how to use it.